

Service Level Benchmarking: How to Know If Your SLA Measures Up
Service level benchmarking is the practice of comparing service performance—such as uptime, response time, resolution time, and answer speed—against an external reference point, such as an industry average, peer group, or published standard. Ordinary performance tracking tells you whether a number is improving. Benchmarking tells you where that number sits against everyone else doing comparable work, which is the question that actually matters when you’re negotiating a contract or defending a budget.
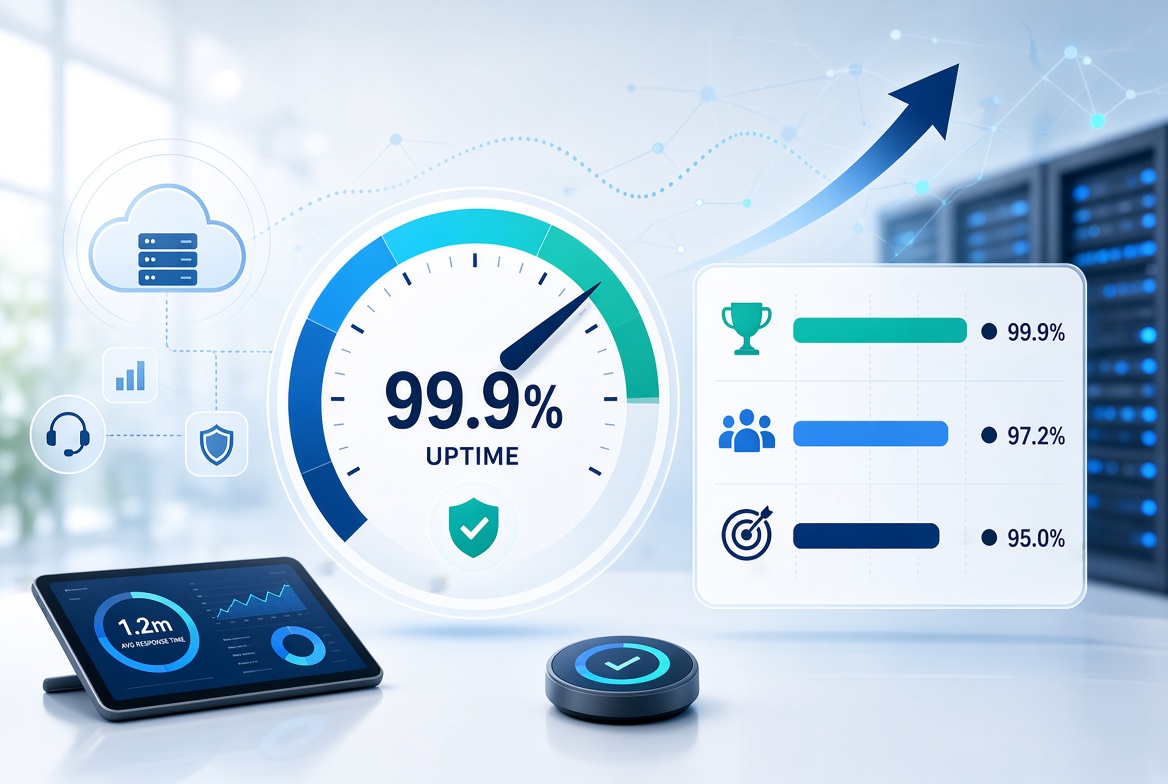
A cloud vendor promising 99.9% uptime may sound impressive, but the number means little without knowing the service, architecture, measurement window, exclusions, and remedies attached to it. The same problem appears in service desks and contact centers: a response-time or first-contact-resolution figure is only useful when the comparison uses similar workloads and definitions. Benchmarking replaces that guesswork with a more defensible reference point.
Table of Contents
How the Pieces Fit: SLI, SLO, SLA, and Benchmark
Benchmarking a service level means taking a measured value (a Service Level Indicator, or SLI), checking it against an internal target (a Service Level Objective, or SLO), and then checking both against what comparable organizations, contracts, or platforms achieve. The Service Level Agreement (SLA) is the contract that makes a target enforceable. The benchmark is an external reference that helps assess whether the target is realistic, competitive, or appropriate for the service being delivered.
| Term | What It Is | Example |
|---|---|---|
| SLI (Indicator) | The actual, measured performance of a service attribute | 99.92% of requests succeeded last month |
| SLO (Objective) | The internal or negotiated target for that indicator | 99.9% success rate |
| SLA (Agreement) | The contractual commitment, typically with a remedy attached | 99.9% uptime, with service credits below that threshold |
| Benchmark | An external reference used to judge whether the SLO/SLA is reasonable | Comparable cloud compute services typically commit to 99.9%–99.99% |
An SLA defines the commitment. A benchmark provides context for judging that commitment. Neither is sufficient on its own: the SLA needs measurable definitions and remedies, while the benchmark needs a comparable peer group and a clear methodology.
Two Directions of Benchmarking
Internal benchmarking compares similar services, teams, locations, or business units within the same organization. For example, a company may compare first-response times across regional service desks or resolution performance across support tiers.
Trend analysis compares the same service against its own historical performance, such as this month’s results versus last month’s. It helps identify improvement or deterioration but does not show whether the service is competitive.
External benchmarking compares performance against a peer group, industry dataset, published standard, or supplier reference. This can be valuable, but only when the comparison accounts for differences in service scope, workload, geography, staffing, and measurement definitions.
The Frameworks Behind Formal Benchmarking
ITIL 4 treats service level management as a practice connected to service value and customer expectations, rather than only a technical reporting exercise. It also supports a broader view of service quality: meeting a numeric SLA target does not automatically mean users had a good experience. This is where experience-focused measures, sometimes described through Experience Level Agreements or XLAs, can add context to traditional service metrics.
ISO/IEC 20000-1:2018 is the international standard for service management systems. It supports the definition of service requirements and service level targets, monitoring against agreed expectations, and continual improvement. Benchmarking can support that process, but the standard should not be described as requiring every organization to use external industry benchmarks.
COBIT, maintained by ISACA, is primarily a governance and management framework for enterprise information and technology. It can help connect service performance with risk, control, and business value.
COPC standards are more directly relevant to certain customer-experience and contact-center operations. They may be useful when benchmarking support quality, customer interactions, workforce performance, and operational controls. The applicable COPC standard depends on the type of service being assessed.
Google’s Site Reliability Engineering approach uses service level objectives and error budgets rather than relying only on external industry averages. An error budget represents the amount of unreliability permitted by the SLO. For example, a 99.9% monthly availability target allows approximately 43 minutes of unavailability in a 30-day month. Teams can use that budget to decide when reliability work should take priority over new feature delivery.
What Gets Benchmarked, by Domain
IT service desks. Common measures include first-contact resolution, first response time, resolution time, cost per ticket, backlog age, escalation rate, and customer satisfaction. There is no universal “good” value for these metrics because results vary significantly with ticket complexity, support hours, staffing model, automation, geography, and the services included. A useful benchmark should therefore compare similar service desks rather than applying one industry-wide target to every organization.
Cloud and infrastructure services. AWS, Microsoft Azure, and Google Cloud publish service-specific SLAs rather than one company-wide availability commitment. The applicable target may depend on the service, deployment architecture, region, redundancy design, and eligibility conditions. For example, a multi-Availability-Zone deployment may qualify for a different commitment than a single-instance design. The percentage alone is therefore not enough for comparison; readers should also examine downtime definitions, exclusions, measurement windows, and service-credit rules. Cloud availability targets are only one part of service performance. Organizations also need effective IT infrastructure management to monitor capacity, availability, configuration, security, and operational risk.
The 80/20 rule — answering 80% of calls within 20 seconds — remains a widely cited contact-center service-level convention. Its historical origin is disputed, and there is no universally accepted evidence that this exact ratio is optimal for every operation. It became popular partly because it was simple to communicate and include in service agreements. Organizations should therefore treat it as a reference point, not a universal law.
The figures below are reference points, not universal performance standards. Actual targets should be adjusted for service scope, architecture, workload, geography, operating hours, and measurement definitions.
| Domain | Common Metric | Illustrative Reference |
|---|---|---|
| IT service desk | First-contact resolution | Often tracked as a percentage; compare only with similar support environments |
| IT service desk | Cost per Level 1 ticket | Highly dependent on ticket complexity, staffing, geography, and automation |
| Cloud infrastructure | Monthly uptime | Often expressed through service-specific availability commitments |
| Contact center | Service level | 80% answered within 20 seconds is a common convention, not a universal optimum |
| Site reliability | Error budget | Derived from the selected SLO and measurement period |
What You Gain From Benchmarking
Benchmarking turns a subjective sense of “we’re doing fine” into a defensible position. It gives operations leaders language for budget conversations, gives negotiators a fact base when a vendor’s SLA looks weak or unusually generous, and gives internal teams an early warning when performance quietly drifts below what peers routinely achieve.
Where Benchmarking Breaks Down
The most common failure is comparing organizations that are not genuinely comparable. A useful benchmark should account for factors such as team size, ticket complexity, service hours, automation, geography, service scope, and escalation rules. Without that context, a benchmark can create false confidence rather than a meaningful performance comparison.
A second failure is trusting the headline number. Response time commitments carry a particular trap: a 15-minute “response” often means acknowledgment, not resolution, and the gap between the two can stretch into hours.
A third is optimizing for the benchmark instead of the outcome it was meant to represent. A team can hit 80/20 consistently while still frustrating customers who wanted their issue solved, not just picked up quickly — exactly the gap XLAs were introduced to address.
Do SLA Credits Cover the Full Cost of an Outage?
Does an SLA credit actually cover what an outage costs you?
Usually, not fully. Service credits are commonly calculated as a percentage of the affected service charges rather than the full business impact of an outage. They may not cover lost revenue, missed transactions, staff time, customer churn, or reputational damage.
That does not make the SLA useless. It defines a measurable commitment and may provide a contractual remedy. But organizations should not assume that service credits equal business-loss compensation. For critical services, the contract should also address exclusions, escalation rights, termination rights, recovery commitments, data protection, and any negotiated remedies for serious failures.
Persistent Misconceptions
“A tougher SLA number is always the better target.” Not if it’s unenforceable or unmeasured in practice — a 99.99% commitment nobody checks against real data is weaker than a 99.9% one backed by a working benchmarking process.
“Meeting the SLA means the customer is satisfied.” Satisfaction reflects the user’s experience, not only the raw metric. Experience-focused measures, sometimes described through XLAs, can add that missing context.
“The 80/20 rule is a scientifically derived standard.” It isn’t. The historical record points to an arbitrary, if durable, industry convention with no confirmed origin.
How to Build a Service Level Benchmarking Process
Start small: define the two or three service indicators that genuinely connect to business outcomes, gather enough internal data to establish a stable baseline, and choose a peer group that matches your scale and service model.
Review frequency should depend on the service. Critical or rapidly changing operations may need monthly or continuous monitoring, while a strategic supplier benchmark may be reviewed quarterly or annually. Treat a gap against the benchmark as a starting point for investigation, not an automatic failure. Pair operational metrics with customer feedback, service quality, and business outcomes so a technically strong score does not hide a poor customer experience.
When Benchmarking Isn’t the Right Tool
Highly customized service arrangements often have no valid peer group to compare against, and forcing a comparison anyway produces false confidence. Brand-new services without a stable baseline are better served by a few months of internal tracking first. And a benchmark that’s drifted away from what actually predicts customer satisfaction is a sign to revisit the metric itself before chasing the number further.
Final Thoughts
Service level benchmarking works best as one input among several, not as a standalone scoreboard. ITIL, ISO/IEC 20000, COBIT, COPC, and SRE practices provide different approaches to service management, governance, measurement, and reliability. None of them replaces judgment about whether a peer group, metric, or target actually reflects what customers experience.
FAQs
What is service level benchmarking?
Service level benchmarking compares your service performance against external data, peer organizations, industry references, or published standards instead of relying only on your own historical results.
What’s the difference between an SLA and a benchmark?
An SLA is a contractual commitment that defines the service a provider promises to deliver. A benchmark provides context for judging whether that commitment is realistic, competitive, or appropriate for the service.
What’s a good uptime benchmark for cloud services?
There is no universal uptime target. Cloud availability commitments depend on the provider, service, architecture, redundancy, measurement method, and SLA conditions. Always compare the exact service terms rather than applying one percentage to every deployment.
Is the 80/20 rule still valid for call centers?
The 80/20 rule remains a widely used contact-center service-level convention, but it is not a universal optimum. Organizations should adjust the target according to customer expectations, call complexity, staffing, operating hours, and resolution quality.
How often should you benchmark SLAs?
The frequency depends on the service. Critical operations may need monthly or continuous monitoring, while strategic supplier benchmarking may be reviewed quarterly or annually. Reassess the benchmark when service scope, technology, customer expectations, or operating conditions change.
What is an XLA?
An Experience Level Agreement, or XLA, focuses on the user’s experience rather than only technical performance. It may include customer satisfaction, ease of use, effort, trust, and whether the service actually helps users achieve their goals.
Can you compare your SLA directly to a competitor’s public SLA?
Not safely without checking the details. Two providers may advertise the same uptime percentage but use different downtime definitions, measurement windows, exclusions, architectures, and service-credit conditions.
What standards support service level benchmarking?
ITIL 4, ISO/IEC 20000-1, COBIT, and relevant COPC standards can support service management, governance, measurement, and improvement. They do not provide one universal benchmark number for every service.
Do SLA credits cover the full cost of an outage?
Usually not. Service credits are commonly calculated as a percentage of the affected service charges and may not cover lost revenue, missed transactions, staff time, customer churn, or reputational damage. Organizations should review the full contract for exclusions, recovery commitments, termination rights, and additional remedies.
What is the difference between internal and external benchmarking?
Internal benchmarking compares similar teams, services, locations, or business units within the same organization. External benchmarking compares performance with outside peer groups, industry datasets, suppliers, or published references.
What metrics are commonly used in service level benchmarking?
Common metrics include uptime, availability, response time, resolution time, first-contact resolution, cost per ticket, customer satisfaction, call-answer speed, backlog age, escalation rate, and error-budget consumption. The right metrics depend on the type of service being measured.
When is service level benchmarking not useful?
Benchmarking may be unreliable when a service is highly customized, the peer group is poorly matched, the service has no stable baseline, or the benchmark measures something unrelated to customer outcomes. In those cases, internal measurement and qualitative customer feedback may be more useful.
References
- MetricNet — IT Service and Support Benchmarking Resources
- MetricNet — Contact Center Benchmarking Resources
- Google SRE — Service Level Objectives
- Google SRE — Error Budgets and Reliability Management
- IBM — Service Level Agreement Overview
- ITIL 4 — Service Level Management Practice Guidance
- ISO/IEC 20000-1:2018 — Information Technology — Service Management — Part 1: Service Management System Requirements
- ISACA — COBIT Governance and Management Framework
- COPC Inc. — Customer Experience and Contact Center Standards
- Amazon Web Services — Amazon EC2 Service Level Agreement
- Google Cloud — Compute Engine Service Level Agreement
- Verint — Manager’s Guide to Call Center Service Levels
- SpringerLink — “Benchmarking: Comparing Apples to Apples,” in Optimizing Software: The Path to a Fixed Price Fixed Scope Contract
- TermScout — SLA Clause Benchmarking and Contract Negotiation Resources