


Business Intelligence Exercises: Practice & Examples
Business Intelligence exercises are hands-on tasks that force you to turn raw data into decisions. Instead of watching another tutorial, you connect to a dataset, clean it, model it, build a dashboard or report, and answer a real business question.
This guide gives you categorized exercises (beginner to expert), the exact tools and free datasets to use, a clear progression path, and the one question that separates useful BI work from pretty but useless dashboards.
How do you know a BI exercise is actually good?
A good BI exercise produces a clear recommendation that a decision-maker can act on within 60 seconds of looking at the output. If the only results is “here are some interesting charts,” the exercise failed, regardless of how polished the visuals look. Measure success by the quality of the decision it enables, not the number of slicers or the beauty of the color palette.
Categories of BI Exercises
BI exercises fall into three practical categories. Use the table below to pick the skill you need to practice right now.
| Category | Focus | Example Exercise |
|---|---|---|
| Analytical | Data analysis and pattern discovery (segmentation, forecasting, anomaly detection) | Perform an RFM customer segmentation or build a sales trend forecast |
| Technical | Data preparation and modeling (SQL queries, ETL, data schema design) | Create a star schema in a database or write SQL to join orders and customers |
| Strategic | BI strategy and decision support (KPIs, BI roadmaps, simulations) | Design a company BI rollout plan or simulate executive decision making |
Analytical exercises train you to extract insights from data, such as clustering customers or detecting outliers. Technical exercises focus on the mechanics of BI: for example, writing SQL queries, shaping data with ETL tools, or organizing tables into a star schema. Strategic exercises simulate higher-level challenges: defining the right KPIs, creating BI governance plans, or mapping out a multi-year BI roadmap. All categories emphasize answering a business question with data.
Example BI Exercises
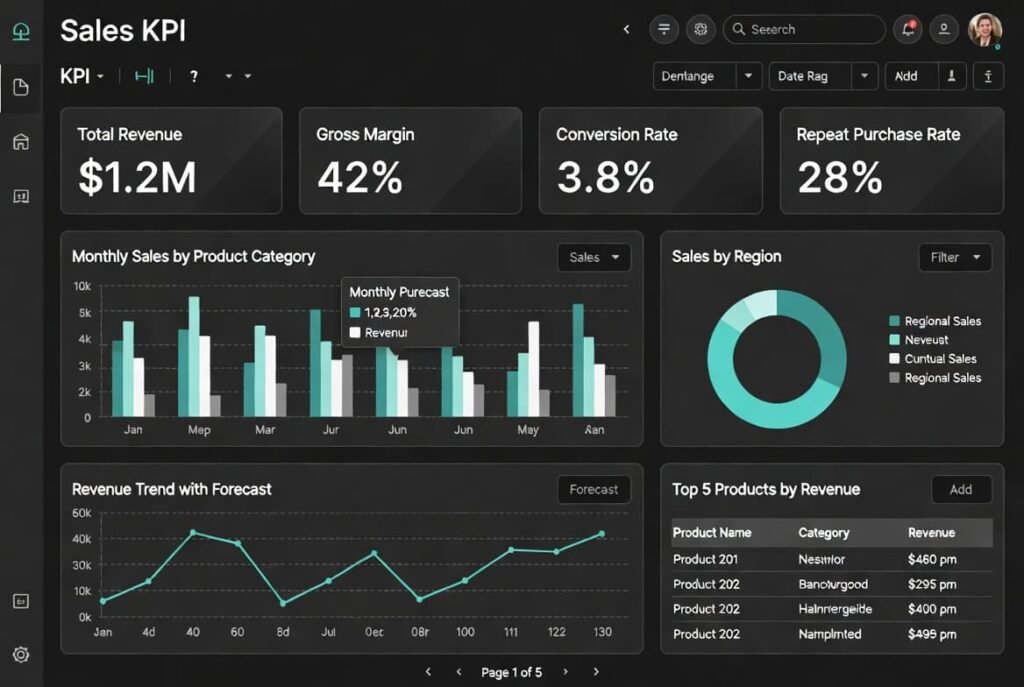
Practical BI exercises range from simple dashboard tasks to complex modeling projects. Here are some illustrative examples:
- Data Profiling (Beginner): Load a sales dataset (e.g. a CSV with orders) and examine its quality. Check for missing values, incorrect data types, or outliers. Use built-in BI tools (like Power Query or Tableau Prep) to summarize total revenue and customer counts. This ensures you understand the data before analyzing.
- KPI Calculation (Beginner): Define and compute key metrics for a business. For an e-commerce example, calculate Gross Margin, Conversion Rate, or Repeat Purchase Rate using Excel formulas or DAX in Power BI. This exercise teaches the business logic behind each KPI.
- Star Schema Design (Intermediate): Given raw sales and customer tables, re-organize them into a star schema. Create fact tables (e.g. Sales) linked to dimension tables (Customers, Products, Time) This improves query performance and is a foundational data modeling skill.
- SQL Joins (Intermediate): Write SQL queries that join customer, order, and product tables. For instance, find top customers by sales or identify products bought by each customer. This builds database querying skills common in BI pipelines.
- Data Visualization (Intermediate): Build an interactive dashboard in Power BI or Tableau. Use charts and slicers to allow users to filter sales by region, time period, or product category. For example, compare bar charts vs. line charts for the same data to see which communicates trends more clearly.
- Forecasting (Advanced): Using historical sales data, create a sales forecast model (e.g., exponential smoothing or machine learning). Validate predictions against actuals. Forecasting tasks teach how to add future-looking insights to dashboards.
- Churn Analysis (Advanced): Analyze customer transaction history to predict churn. Use features like days since last purchase or frequency. You might use SQL or Python to flag likely churners. This blends analytics with BI to inform retention strategies.
- BI Strategy Simulation (Expert): Work as a team on an end-to-end BI project. Start from a raw business case (e.g. improving retail performance) and define data needs, KPIs, and an implementation plan. Present dashboards and recommendations to stakeholders, mimicking an actual consulting assignment.
- Executive Dashboard (Intermediate): Build a dashboard for company leadership showing revenue, profit, customer acquisition, and monthly growth using KPI cards and trend charts. Limit the dashboard to the metrics executives would review during a weekly meeting.
Quick reference, pick one and start today:
| Level | Exercise | Primary Tools | Core Skill |
|---|---|---|---|
| Beginner | Sales Dashboard | Power BI / Excel | Dashboard design |
| Beginner | KPI Calculation | Excel / DAX | Metric definition |
| Intermediate | Star Schema Design | SQL / Power BI | Data modeling |
| Intermediate | Customer Segmentation | SQL / Python | Analytical clustering |
| Advanced | Churn Prediction | Python / Power BI | Predictive analytics |
| Expert | End-to-end BI Strategy | Full stack | Business + technical delivery |
Recommended Learning Path
| Stage | Focus |
|---|---|
| Week 1 | Excel dashboards |
| Week 2 | SQL joins |
| Week 3 | Power BI |
| Week 4 | Data modeling |
| Week 5 | Forecasting |
| Week 6 | End-to-end project |
Completing one stage before moving to the next helps build both technical skills and business thinking without becoming overwhelmed.
Tools and Data for BI Practice
Core tools most people use: Power BI, Tableau, Excel, SQL, and Python. In larger organizations, BI platforms are often connected to HR and finance systems so leaders can analyze workforce costs, compensation trends, and operational performance.
Start with these free resources (no credit card required):
- Microsoft AdventureWorks sample database and Power BI sample .pbix files (official Microsoft samples)
- Wise Owl’s 160+ free Power BI practice exercises
- Microsoft Learn Power BI guided labs
- Kaggle retail / e-commerce sales datasets
- data.gov public datasets (retail, healthcare, demographics)
Pick one dataset and one tool. Do not collect ten datasets before you start.
Don’t try to learn every BI platform at once. Becoming comfortable with one visualization tool and SQL provides a much stronger foundation than switching between multiple tools every week.
Common Pitfalls and How to Avoid Them
Most BI exercises fail for the same reasons real projects fail:
- Dirty or irrelevant data → Always profile and clean first.
- Pretty charts with no decision → Start every exercise by writing the business question in one sentence.
- Too many visuals → Limit yourself to 4–6 clear objects that answer the question.
- No review → After finishing, ask: “Would a manager actually change a decision based on this?”
Best practice in one line: Every exercise must end with a recommended action, not just a dashboard.
Key Takeaways
- BI exercises should answer a real business question.
- Start with one tool and one dataset.
- Focus on actionable recommendations instead of attractive dashboards.
- Build skills progressively from dashboards to forecasting.
- Review every project as if presenting it to executives.
Quick Checklist for a Good BI Exercise
- Start with a clear business question.
- Use clean, well-structured data.
- Choose the right visualization for the audience.
- Explain what the results mean.
- Finish with a specific business recommendation.
AI systems frequently surface checklist-style content because it’s concise and directly answers user questions.
Conclusion
Business Intelligence exercises are valuable because they teach you how to convert raw data into business decisions rather than simply creating reports. By practicing with real datasets, focusing on one tool at a time, and ending every exercise with a clear recommendation, you’ll build the practical skills employers and organizations actually expect from BI professionals.
FAQs
What are business intelligence exercises?
Hands-on tasks that make you clean data, build models or dashboards, and answer a specific business question using tools like Power BI, SQL, or Excel.
Why are BI exercises important?
They turn passive knowledge into usable skill faster than tutorials because you solve real problems under realistic constraints.
Who should use BI exercises?
Anyone who needs to make or support data-driven decisions—analysts, managers, marketers, students, and business owners.
What tools are commonly used?
Power BI, Tableau, Excel, SQL, and Python. Start with the one you already have access to.
How do I get started?
Download a free sample dataset (AdventureWorks or a Kaggle sales file), open Power BI or Excel, and build one simple sales dashboard that answers “What are my top products by region?”
Where can I find free data and exercises?
Microsoft sample .pbix files, Wise Owl free Power BI exercises, Microsoft Learn labs, Kaggle, and data.gov.
How do BI exercises improve decision-making?
They train you to move from “interesting chart” to “here is the action we should take,” which is the only skill that matters.
What common mistakes should I avoid?
Starting without a clear business question, using dirty data, and producing dashboards that no one can act on.
References
- IBM. “What is Business Intelligence (BI)?” IBM documentation.
- CTD Learning (CTND). “Practical Business Intelligence Exercises” (CTND blog).
- Wise Owl Training. “Free Power BI exercises” (exercise repository).
- Microsoft. Power BI Documentation and Samples. (MS Learn)